


Crypto sentiment platforms analyze market emotions to predict price trends. They gather data from social media, news, and blockchain activity, using AI and machine learning to interpret investor psychology. These tools are essential for navigating the volatile crypto market, as emotional shifts often precede price changes.
Key Insights:
- Data Sources: Platforms pull from social media (X, Reddit, Telegram), news outlets, and blockchain data.
- Metrics: Tools like the Fear & Greed Index, funding rates, and whale activity help traders gauge market sentiment.
- AI-Driven Analysis: Advanced models like GPT-4 decode crypto-specific jargon and trends in real-time.
- Top Platforms:
- LunarCrush: Focuses on social media trends with tools like Galaxy Score™ and AltRank™.
- Santiment: Combines on-chain data and sentiment analysis for insights like MVRV and whale tracking.
- Glassnode: Specializes in blockchain network health with metrics like NUPL and exchange flows.
Quick Comparison:
| Platform | Focus | Key Features | Starting Price |
|---|---|---|---|
| LunarCrush | Social media intelligence | Galaxy Score™, AltRank™ | Free / $72/mo |
| Santiment | On-chain and sentiment | MVRV, Whale Transactions | Free / Paid |
| Glassnode | On-chain market analysis | NUPL, Exchange Flows | Contact Sales |
These platforms help traders, OTC desks, and investors make informed decisions by combining sentiment data with actionable metrics. For best results, cross-check multiple indicators like social volume, funding rates, and on-chain activity.
Sentiment analysis isn’t just a tool – it’s a way to stay ahead in crypto’s emotion-driven markets.
Key Features of Crypto Sentiment Platforms
Data Sources: Social, News, and On-Chain Analysis
Crypto sentiment platforms pull information from three main sources to gauge market psychology. Social media platforms like X (formerly Twitter), Reddit, Discord, and Telegram capture real-time chatter from retail traders and influencers. These platforms are monitored by AI systems that track metrics like mention volume, engagement rates, and shifts in narratives. This helps identify trends before they gain widespread attention.
News and media outlets provide another critical layer of insight. Platforms monitor crypto-specific sources such as CoinDesk and The Block, alongside mainstream financial media like Bloomberg and Reuters. These sources are essential for staying updated on major developments, including regulatory changes, institutional adoption, and ETF news – all factors that influence long-term market sentiment.
Lastly, on-chain data gives a clear view of actual blockchain activity, often referred to as "behavioral truth." Unlike social data, which can be manipulated, on-chain metrics reflect real financial movements. Key indicators include exchange inflows and outflows (showing whether traders are selling or holding), whale wallet activity, and realized profit/loss figures. When social sentiment and on-chain data conflict, the on-chain signals often prove more reliable, as they reveal actual capital flows rather than speculative chatter. Together, these data streams shape the metrics used in sentiment analysis.
Common Metrics: Fear & Greed, AltRank, and Social Dominance
One of the most well-known sentiment tools is the Crypto Fear & Greed Index, which scores the market on a scale from 0 to 100. Scores below 25 indicate "Extreme Fear", often seen as a potential buying signal, while scores above 75 suggest "Extreme Greed", which could signal market tops. The index combines several factors: volatility (25%), market momentum and volume (25%), social media activity (15%), surveys (15%), Bitcoin dominance (10%), and search trends (10%) [5][9].
Funding rates are another key metric, revealing how traders are positioned. For example, rates above 0.1% indicate an overheated long market, while rates below -0.05% suggest a potential short squeeze. Research shows that when funding rates spike above 0.04%, there’s a 58% chance of a 3%+ price correction within 72 hours [10].
Social metrics like Social Volume (total mentions), Social Dominance (an asset’s share of voice compared to others), and AltRank (a metric combining social and market performance) provide additional insights. These metrics are especially useful for spotting retail-driven FOMO but are vulnerable to bot manipulation. To improve reliability, they are best paired with order book analysis and actual capital flow data [5][4].
AI and NLP in Sentiment Analysis
AI and natural language processing (NLP) take sentiment analysis to the next level by delivering real-time insights from massive data sets. For example, in 2024, Crypto.com used generative AI models on AWS to provide market insights to its 100 million users in under a second. These systems process unstructured data to create instant snapshots of market sentiment [4].
Advanced NLP models like BERT and GPT-4 play a crucial role in deciphering crypto-specific language, including slang and sarcasm. Terms like "HODL", "WAGMI", and "diamond hands" are easily understood by these models, which traditional tools often miss [8][7].
The most effective sentiment platforms combine AI-driven social analysis with on-chain data to filter out manipulation and highlight genuine market trends. As Kalena aptly states:
Sentiment is the question – The order book is the answer. [10]
sbb-itb-c5fef17
Crypto Sentiment Analysis: All You NEED To Stay Ahead!! 💯
Leading Crypto Sentiment Platforms
Comparison of Top 3 Crypto Sentiment Analysis Platforms
When it comes to understanding the mood of the crypto market, top platforms offer unique tools and insights that help traders and analysts make informed decisions.
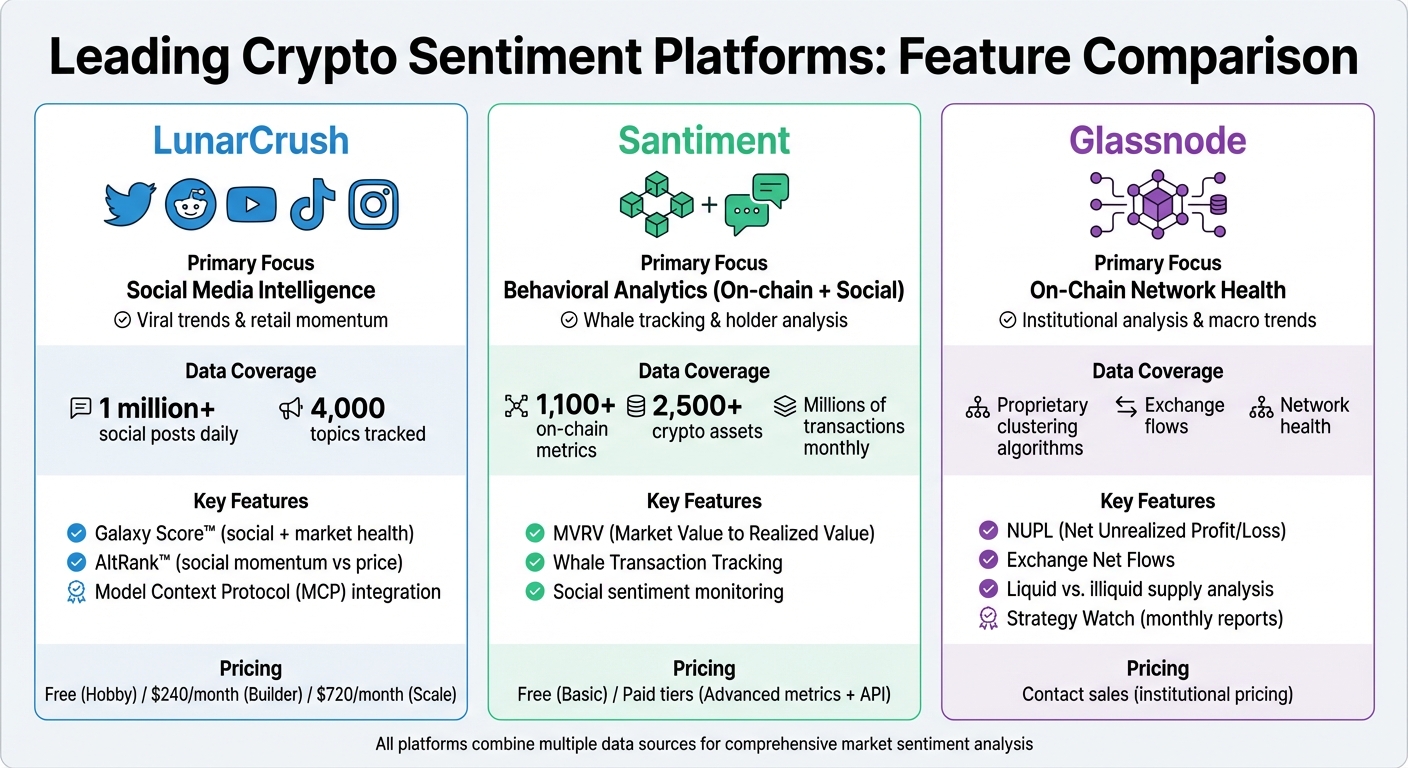
LunarCrush: Social Media Insights

LunarCrush focuses on Social Intelligence, analyzing over 1 million social media posts daily from platforms like X, Reddit, YouTube, TikTok, Instagram, and various news outlets. It tracks 4,000 topics across multiple networks to provide a comprehensive view of social trends[11]. Two standout tools include:
- Galaxy Score™: Combines social and market health metrics into a single score.
- AltRank™: Tracks social momentum relative to price movements, helping traders identify assets gaining traction quickly[11].
As LunarCrush explains:
We don’t guess. We analyze millions of signals across the social web every day to give you the clearest picture of what the market is thinking, feeling, and doing[11].
LunarCrush offers tiered pricing plans, starting with a free Hobby plan (limited to market data), followed by paid options like Builder at $240/month and Scale at $720/month. The platform also integrates a Model Context Protocol (MCP) server for AI workflows, including narrative tracking through Claude AI[11].
On the other hand, Santiment takes a deeper dive into on-chain behavioral data for its insights.
Santiment: On-Chain and Social Metrics
Santiment blends on-chain data with sentiment analysis, monitoring millions of transactions and social messages every month. The platform covers over 1,100 on-chain metrics for more than 2,500 crypto assets[13][15]. Key features include:
- MVRV (Market Value to Realized Value): Tracks trader profitability, often signaling market turning points.
- Whale Transaction Tracking: Highlights when large holders are buying or selling, confirming shifts in market sentiment[13].
For example, in April 2026, Santiment noted:
social sentiment around $XRP has hit its third most bearish reading in two years, following a 63% price decline from its July 2025 high of $3.60[14].
Extreme sentiment readings like this often signal a potential trend reversal. Santiment offers a free tier for basic usage, with advanced metrics and API access available through paid subscriptions[13].
While LunarCrush and Santiment focus on social and behavioral trends, Glassnode zeroes in on blockchain network health.
Glassnode: Market Sentiment and Network Health
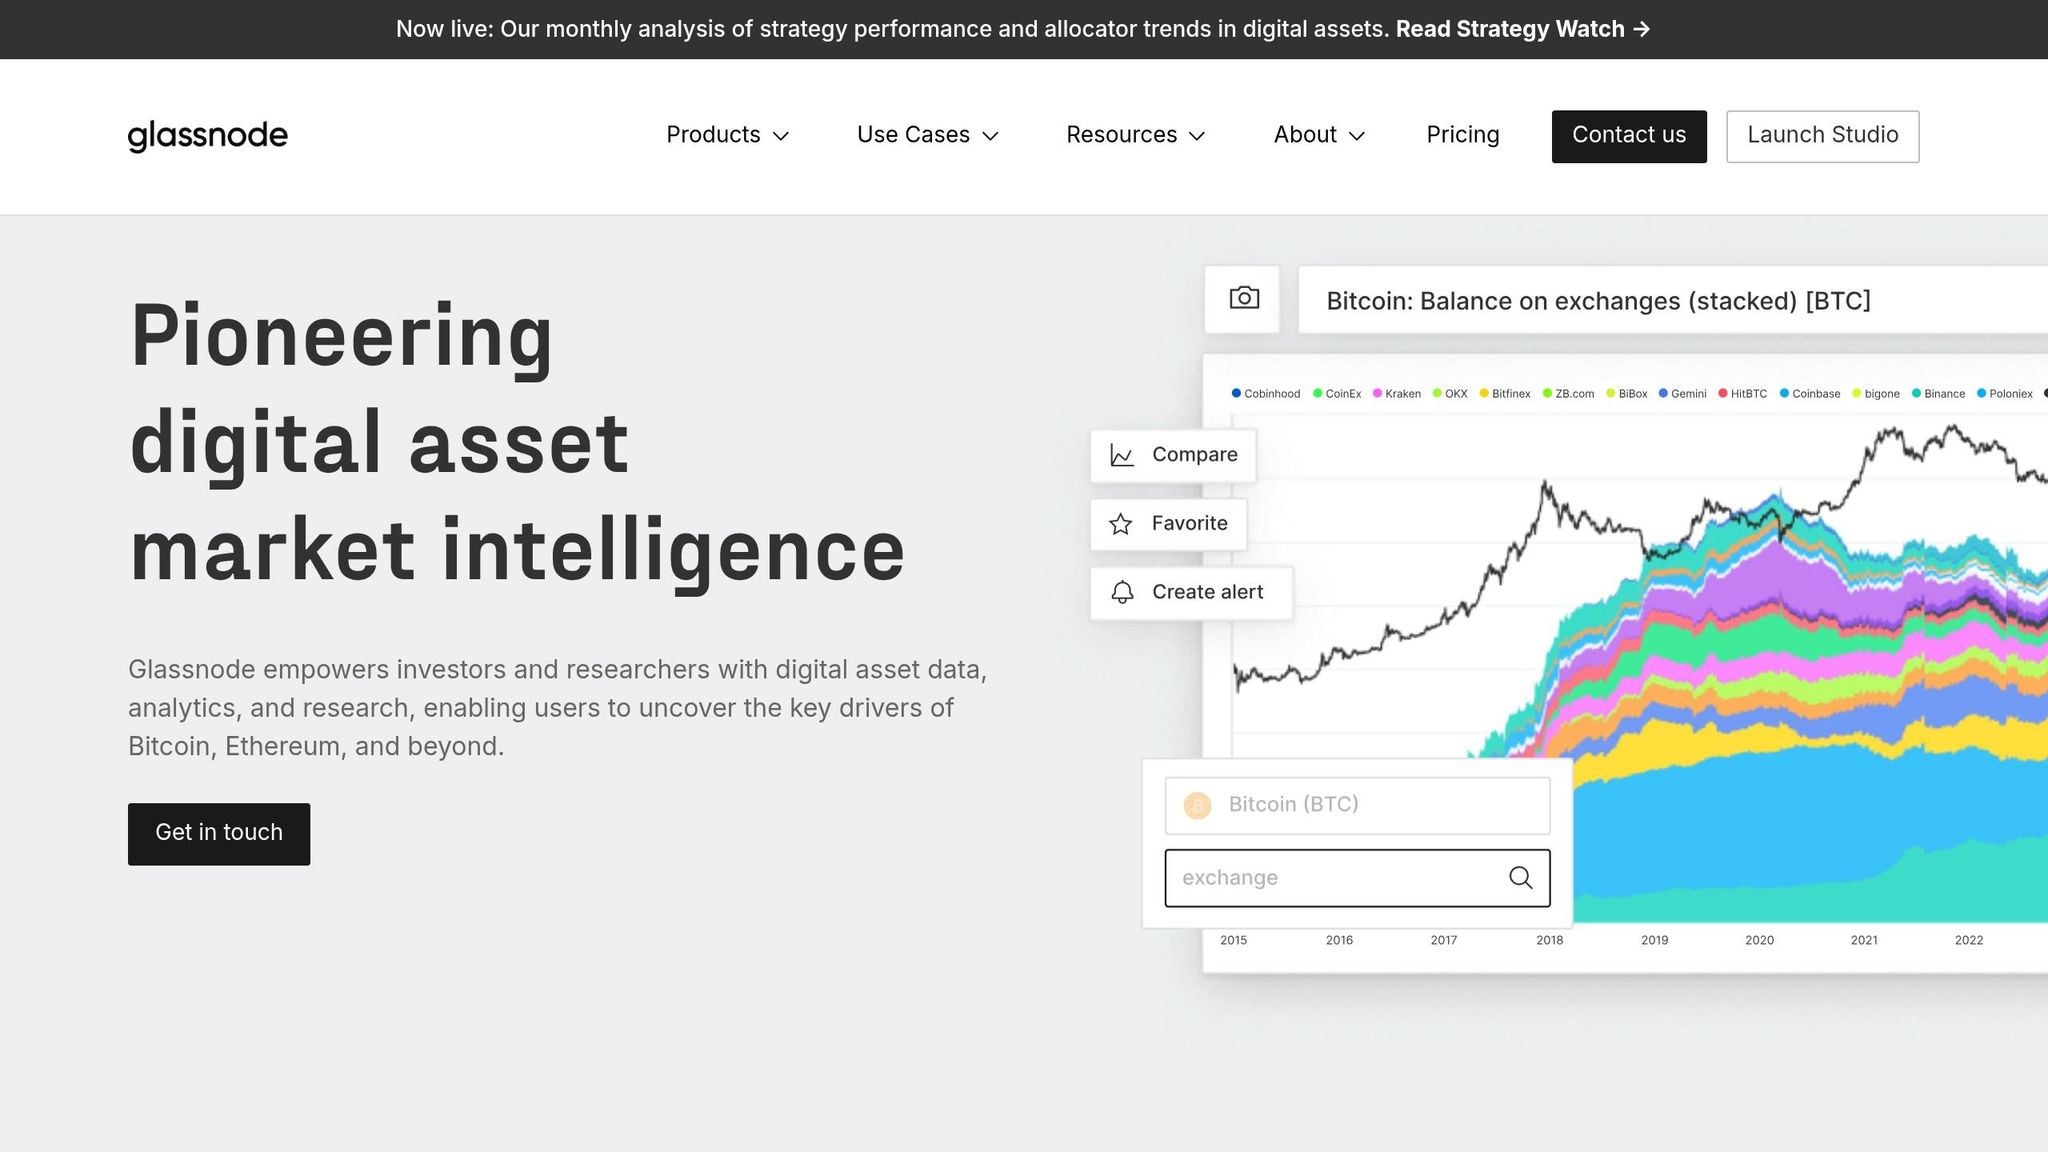
Glassnode specializes in On-chain Market Intelligence, using proprietary clustering algorithms to analyze blockchain data, exchange flows, and network health. Its tools are particularly suited for institutions seeking in-depth fundamental analysis. Key metrics include:
- Net Unrealized Profit/Loss (NUPL): Measures the overall profit positions of network participants.
- Exchange Net Flows: Tracks capital movement to and from exchanges, signaling market pressure.
Glassnode also examines liquid vs. illiquid supply, identifying how much of an asset is actively traded versus held long-term[4]. The platform collaborates with major institutions like Coinbase and CME Group, providing quarterly reports and market insights. Its Strategy Watch feature delivers monthly updates on strategy performance and allocator trends in digital assets[12].
Glassnode’s pricing varies and is tailored to institutional needs, with specific costs available through direct contact with their sales team[12].
| Platform | Primary Focus | Best For | Key Metric | Pricing Starts At |
|---|---|---|---|---|
| LunarCrush | Social Media Intelligence | Viral trends & retail momentum | AltRank™, Galaxy Score™ | Free / $72/month |
| Santiment | Behavioral Analytics | Whale tracking & holder analysis | MVRV, Whale Transactions | Free / Paid tiers |
| Glassnode | On-Chain Network Health | Institutional analysis & macro trends | NUPL, Exchange Flows | Contact sales |
Using Sentiment Platforms in Web3 Strategies
Sentiment platforms aren’t just for day traders – they’re incredibly useful for Web3 ventures, institutional investors, and those evaluating early-stage projects. The key is identifying the right metrics for your specific goals. By analyzing data from social media, news, and blockchain activity, these strategies use sentiment metrics to inform decisions in the Web3 space.
Sentiment Analysis for OTC Market Solutions
OTC desks, which handle large-scale transactions, rely heavily on monitoring market conditions before executing trades worth millions. Tracking whale activity is critical here. When major holders transfer assets to centralized exchanges, it often signals selling pressure, giving OTC buyers an advantage in negotiating better entry prices [16][18].
Exchange inflows and outflows also offer valuable insights. High inflows usually indicate bearish sentiment and potential downward price pressure, while outflows into cold storage suggest long-term holding and confidence in the asset’s value [17][18].
For OTC strategies, metrics like NUPL (Net Unrealized Profit/Loss) can help pinpoint ideal entry points. During phases of extreme fear (capitulation), desks can secure assets at lower prices. On the flip side, during periods of extreme greed (euphoria), the risk of corrections often leads to higher premiums [4][3].
These liquidity trends also play a role in shaping strategies for secondary markets.
Improving Secondary Market Investments
In secondary markets, timing is everything, and sentiment indicators often serve as reliable contrarian signals. For instance, trading strategies that purchased Bitcoin when the Fear & Greed Index stayed below 20 for three consecutive days showed a 78% success rate over a 30-day holding period [20].
A study from the University of Auckland in August 2025 revealed that combining TikTok and Twitter sentiment boosted cryptocurrency return forecasts by 20%. TikTok sentiment alone improved short-term price predictions for speculative coins like Dogecoin by 35% [19]. Additionally, when Reddit mentions of an altcoin exceed three standard deviations above their 30-day average, the coin usually experiences 32% higher volatility within the next 48 hours [20].
These insights go beyond market timing and also support strategic evaluations of early-stage projects.
Evaluating Early-Stage Project Support
For Web3 investors, sentiment often predicts price movements, as crypto assets are highly influenced by narratives and hype [4]. Experienced investors focus on velocity – how quickly mentions increase – rather than just volume to identify emerging hype cycles before they peak [6].
Developer activity on platforms like GitHub can reveal a project’s technical progress. Metrics such as commits, pull requests, and active contributors help separate genuine development from marketing buzz [3].
Another key signal is sentiment divergence. For example, when a project’s price drops but social sentiment stays positive, it might indicate a "buy the dip" opportunity. Conversely, rising prices paired with declining social engagement could signal an overextended rally. To make informed decisions, it’s best to cross-check at least three indicators – such as social volume, funding rates, and on-chain accumulation – before taking action [21].
| Indicator | Best Application | Key Signal |
|---|---|---|
| Exchange Inflows | OTC timing | High inflows suggest selling pressure [17] |
| Funding Rates | Risk assessment | Extreme positive rates indicate overcrowded longs, increasing the risk of a long squeeze [9] |
| Social Volume Spike | Volatility trading | Spikes above 3 standard deviations predict 32% higher volatility [20] |
| Developer Activity | Project evaluation | GitHub commits highlight technical progress [3] |
| Velocity vs. Volume | Early-stage hype detection | Rapid mention increases signal emerging trends [6] |
Conclusion
Crypto sentiment platforms bring together various data sources to help predict market movements. As cryptocurrency markets are heavily influenced by narratives and emotions, these tools have become crucial for understanding market behavior [5][2]. Prices in this space often respond to collective momentum, making sentiment analysis a key component in grasping these dynamics.
The most effective strategies layer multiple data points: social media activity reflects retail sentiment, funding rates highlight leveraged positions, and on-chain data tracks real capital flows [5][2]. On-chain metrics, in particular, act as a safeguard against misleading social signals, providing a clearer picture of actual market activity [5][2].
"Ignoring sentiment in crypto is like ignoring wind direction when sailing. You may have a good vessel, but you risk being blown off course." – Bitunix [2]
While sentiment analysis is powerful, it’s best used as a contextual tool rather than a standalone method. For instance, a hybrid strategy combining the 14-day RSI with sentiment scores achieved a return of 38.7%, compared to Bitcoin’s 8.85% [4]. However, waiting for additional confirmation – like a reversal candle, structural break, or momentum shift – is critical before acting on sentiment signals [5][1][4].
Key Takeaways
Here are the main points to remember:
- Instead of aiming to catch exact tops or bottoms, scale into positions gradually when sentiment reaches extreme levels [5].
- Always cross-check signals across multiple platforms. A combination of at least three indicators – such as social volume, funding rates, and on-chain data – can improve decision-making.
The platforms discussed in this guide, from social sentiment tools to on-chain analytics, provide distinct yet complementary insights. By blending these tools with technical analysis and sound risk management, you’ll be better prepared to navigate crypto’s volatile, emotion-driven cycles. Whether you’re exploring OTC trades, secondary investments, or early-stage opportunities, these strategies can help you make more informed choices.
At Bestla VC, we use these insights to craft forward-thinking strategies in the ever-evolving world of web3 and digital finance.
FAQs
How can I tell if a sentiment spike is real or bot-driven?
To figure out if a sentiment spike is real or the result of bot activity, start by checking for steady social media activity that aligns with actual market movements. Bot-driven spikes often come with repetitive posts, usually from brand-new or questionable accounts, and tend to lack genuine interaction from real users.
You can also use advanced tools to dig deeper. These tools analyze things like the credibility of accounts, engagement trends, and unusual sentiment patterns. For example, if positive sentiment is climbing while prices are falling, it might be a sign of bots at work.
Which 3 indicators should I combine before making a trade?
To navigate the markets effectively, consider combining these three indicators for a broader perspective on sentiment:
- Fear & Greed Index: This measures investor emotions, where extreme fear might hint at a market bottom, and extreme greed could signal a potential top. It’s a quick snapshot of overall sentiment.
- Funding Rates: These indicate market momentum by showing the cost of leveraged positions. High or low rates can reveal whether traders are leaning bullish or bearish.
- Social Media Trends: By analyzing online discussions, you can gauge crowd psychology and spot shifts in sentiment that might not yet be reflected in the market.
Using these tools together can help confirm market signals and manage risks, especially during volatile periods.
How can I use sentiment data for OTC and secondary buys without chasing hype?
To steer clear of getting caught up in hype when making OTC or secondary market purchases, prioritize objective, institutional-grade sentiment analysis. Leverage tools that track on-chain data, monitor whale wallet activity, and analyze institutional transactions to uncover real market trends. Additionally, gaining a solid understanding of OTC market structures and keeping an eye on large-scale transactions can provide insights into the strategies of major players, helping you focus on informed decisions rather than reacting to fleeting market emotions or social media buzz.