
Private credit funds and direct lending are two key strategies for investors navigating the growing $1.7 trillion private credit market (as of 2024). Both approaches offer unique benefits and risks, making them essential tools for portfolio allocation, especially in Web3 and blockchain ecosystems. Here’s what you need to know:
- Private Credit Funds: These pool capital to provide loans outside public markets, offering diversification and higher return potential (12–20% net IRR). They often include asset-based finance and venture lending, making them ideal for early-stage startups.
- Direct Lending: Focused on first-lien, senior secured loans, this strategy prioritizes downside protection, stable cash flow, and floating-rate yields (7–12% net IRR). It suits established companies with predictable revenues.
Quick Comparison
| Feature | Private Credit Funds | Direct Lending |
|---|---|---|
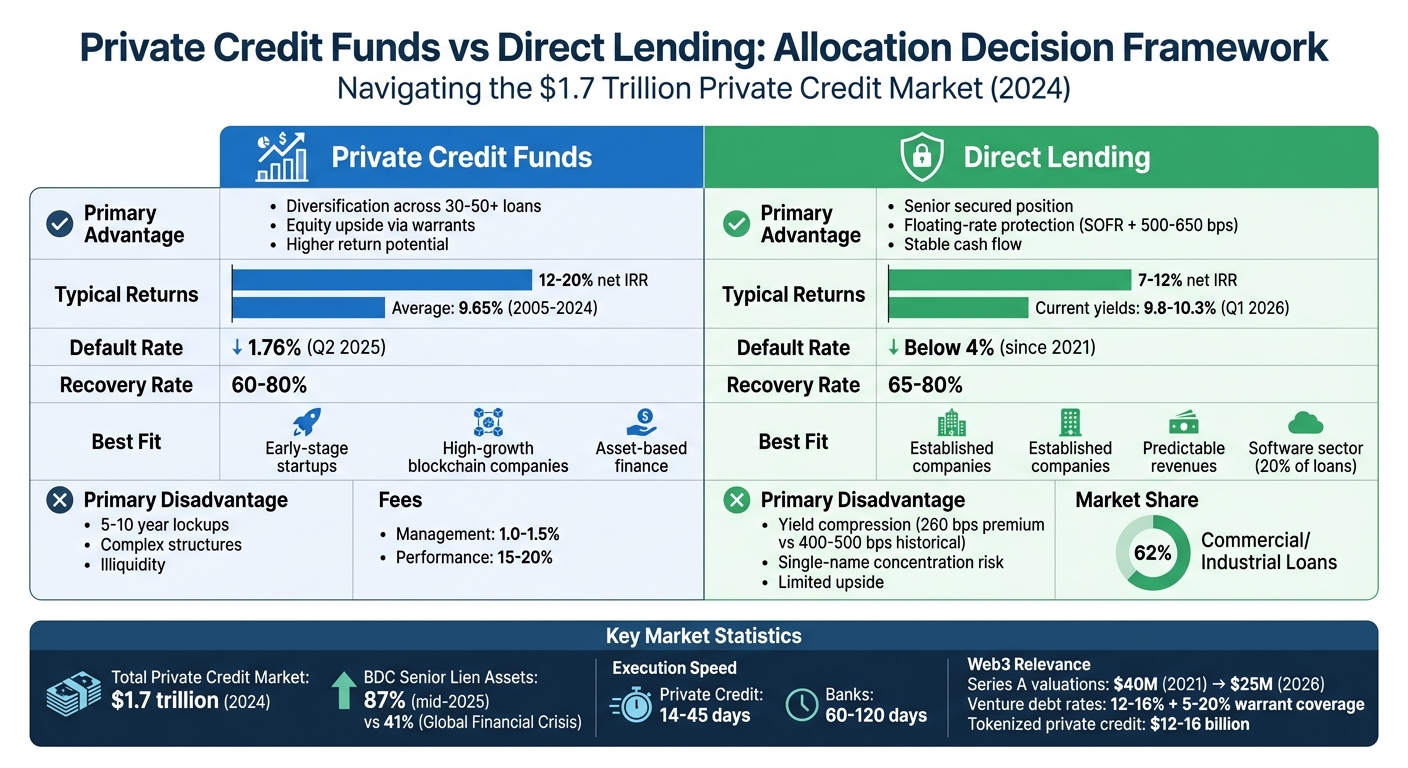
| Primary Advantage | Diversification, equity upside | Senior secured, floating rates |
| Primary Disadvantage | Illiquidity, complex structures | Yield compression, single-name risk |
| Typical Returns | 12–20% net IRR | 7–12% net IRR |
| Best Fit | Early-stage startups | Established companies |
Both strategies can complement each other in a Web3 portfolio. Direct lending offers stability, while private credit funds provide growth opportunities. The right mix depends on your risk tolerance, liquidity needs, and investment goals.
Private Credit Funds vs Direct Lending: Key Differences and Returns Comparison
1. Private Credit Funds
Structure and Risk
Private credit funds gather institutional capital to provide loans outside of public markets. They are structured in various ways, including Business Development Companies (BDCs), interval funds, and private credit ETFs [4][12].
BDCs operate as closed-end funds, distributing over 90% of their taxable income and leveraging up to a 2:1 debt-to-equity ratio. Interval funds, on the other hand, offer quarterly liquidity at Net Asset Value. Meanwhile, private credit ETFs, such as State Street and Apollo’s PRIV, combine liquid public bonds with a 10–35% allocation to private loans [4][12]. Traditional private credit funds often rely on drawdown structures, involving 5–10 year lockups and periodic capital calls [4][12].
Risk management in these funds emphasizes senior secured positions, giving them priority for repayment and claims on borrower assets. Unlike covenant-lite public loans, private credit loans enforce strict maintenance covenants, including leverage and interest coverage tests, allowing for early intervention when needed [6][11]. Most loans are floating rate, tied to SOFR (e.g., SOFR + 500–650 basis points), which helps mitigate interest rate risk by adjusting yields as rates rise [11][12]. To further manage risk, portfolios typically include 30–50 or more loans spread across industries, reducing exposure to any single borrower [6]. These strategies are key to delivering the stable yields highlighted below.
Performance and Yield
From 2005 to 2024, private credit funds delivered an average return of 9.65%, offering a 200–400 basis point premium over high-yield bonds and broadly syndicated loans [6][11][13]. For senior direct lending, yields are projected to range between 9% and 13% in 2025 and 2026 [6][12]. This higher return compensates investors for the lower liquidity compared to public markets.
Default rates in private credit funds remain low. As of Q2 2025, Proskauer’s Private Credit Default Index reported a default rate of 1.76%, significantly lower than the 3.37% default rate for broadly syndicated loans during the same period [12][13]. Additionally, recovery rates for senior secured private loans typically range between 60% and 80% [4][6]. The BDC market has also shifted toward safer investments - senior lien assets now make up 87% of holdings as of mid-2025, a sharp increase from 41% during the Global Financial Crisis [13]. These strong performance metrics underscore the appeal of private credit funds, especially when considering their integration into Web3 strategies.
Web3 Portfolio Fit
Private credit funds have become an essential component of Web3 portfolio strategies. They provide structured lending opportunities for early-stage, high-growth blockchain companies, often through venture lending [10]. Unlike traditional bank loans, these funds can negotiate equity kickers, such as warrants or equity-linked upside, allowing participation in potential equity gains while maintaining a senior debt position [3].
This flexibility is particularly valuable in volatile sectors. Integrow Asset Management highlights:
Private credit is no longer a tactical yield enhancer. It is a strategic sleeve built on control, discipline, and durable income generation. [3]
As banks pull back from complex sectors due to stricter capital requirements, private credit funds are stepping in to offer customized solutions and faster execution times - typically 14–45 days compared to the 60–120 days required by banks [8]. The rise of asset-based finance has further expanded opportunities, enabling loans backed by niche assets like intellectual property and digital infrastructure, which are especially relevant to blockchain-related projects [9]. Management fees for these funds typically range from 1.0% to 1.5% of assets, with performance fees between 15% and 20% above a hurdle rate of 6%–8% [4][6].
sbb-itb-c5fef17
2. Direct Lending
Structure and Risk
Direct lending operates on a “loan to hold” model, where lenders originate first-lien, senior secured loans and retain them until maturity. This approach allows lenders to build ongoing relationships with borrowers, who often return for future financing needs [11][16].
The structure prioritizes first-lien senior secured debt, giving lenders priority claims on assets [11][5]. Unlike covenant-lite loans in public markets, direct lending includes maintenance covenants - such as leverage and interest coverage tests - that allow lenders to intervene early if financial conditions worsen [11][16]. By Q1 2026, global private credit assets topped $1.7 trillion, with direct lending making up 62% of all commercial and industrial loans, reflecting its growing importance in portfolio strategies [11][14].
Yields in direct lending vary, ranging from SOFR + 500–650 basis points for middle-market deals to SOFR + 425–525 basis points for larger transactions [11]. Additionally, lenders typically charge a 1–2% original issue discount (OID) at loan origination [11]. Default rates have stayed below 4% since 2021, and recovery rates for senior secured loans are between 65% and 80%, significantly better than the 40% average for high-yield bonds [5][11].
This combination of structural safeguards and attractive yields makes direct lending a competitive option for investors.
Performance and Yield
Direct lending builds on its secure structure to deliver strong returns. By Q1 2026, all-in yields ranged from 9.8% to 10.3%, driven by floating-rate coupons tied to SOFR [11]. In late 2025, direct lending offered a 260 basis point yield premium over leveraged loans, although this premium has narrowed from its historical average of 400–500 basis points due to heightened competition [14].
Private lenders demonstrated their competitive edge in 2024 by leading a $4 billion refinancing for PCI Pharma, outperforming traditional syndicated loan markets [16]. That same year, Ares Management closed its Opportunistic Credit strategy fund in April 2026, raising over $9.8 billion to target middle-market companies facing refinancing challenges [15]. The software industry, with its high-margin and recurring revenue models, accounts for about 20% of outstanding loans in private direct lending [14].
“Direct lending still offers a premium to comparable credit opportunities even if it’s not as strong as it once was.” - iCapital [14]
Web3 Portfolio Fit
Direct lending’s yield profiles make it an attractive option in Web3 portfolios, especially as equity valuations remain under pressure. For instance, Series A valuations dropped from $40 million in 2021 to $25 million in 2026, making venture debt a preferred choice for founders looking to extend their runway without heavily diluting equity [15]. Institutional investors can offer loans to blockchain startups at interest rates ranging from 12–16%, often paired with 5–20% warrant coverage [17].
The software sector’s prominence in leveraged finance - contributing roughly one-third of a point to annual U.S. GDP - naturally extends to blockchain infrastructure and digital platforms [14]. Direct lending also supports digital infrastructure projects, such as data centers and on-chain protocols, by providing collateral-backed loans [5]. With equity exit markets stalled and private equity multiples falling from 11.2x EBITDA in 2021 to 9.3x in 2026, institutional investors are increasingly shifting capital to credit strategies that offer steady income and downside protection [15].
“As equity becomes harder to access, debt becomes the growth lever - exactly the trade institutional investors already made.” - David Chen, Author [15]
What is Private Credit? | Direct Lending Explained
Advantages and Disadvantages
Understanding the upsides and downsides of these strategies can refine how you approach portfolio allocation within the Web3 ecosystem. Direct lending stands out for its seniority in the capital stack and floating-rate protection, making it a practical choice when interest rates rise or when downside protection is a priority [1]. However, yield compression has become a challenge. By late 2025, the premium over leveraged loans narrowed significantly, dropping from a historical range of 400–500 basis points to just 260 basis points [14].
On the other hand, private credit funds bring their own set of benefits. Those focusing on asset-based finance (ABF) offer diversification by securing loans against pools of receivables or physical assets, rather than relying on single-name corporate risk [9]. This approach results in more predictable loss curves, compared to the binary defaults often seen in direct lending [18]. ABF strategies also tend to be self-amortizing, meaning liabilities are gradually reduced over time. This reduces portfolio risk, whereas direct lending frequently depends on large bullet payments at maturity [24, 25].
“Direct lending is concentrated risk with tail outcomes; ABF is distributed risk with more predictable loss curves.” - Alterest [18]
Here’s a quick comparison of the key features, advantages, and disadvantages of these strategies:
| Feature | Direct Lending | Private Credit Funds (ABF/Broad) |
|---|---|---|
| Primary Advantage | Senior secured position; floating rates; stable cash flow | Diversified collateral; higher return potential; equity upside via warrants |
| Primary Disadvantage | Yield compression; limited upside; single-name concentration | Illiquidity due to 10-year lockups; complex tax reporting; higher default risk |
| Best Market Condition | Rising rates; bank retrenchment | Market volatility; early-stage growth; asset-heavy operations |
| Typical Returns | 7–12% net IRR | 12–20%+ net IRR (opportunistic strategies) |
| Recovery Rates | 50–60% (first-lien) | Varies by asset class; typically lower for subordinated positions |
These differences go beyond simple risk and return metrics, carrying important implications for Web3-focused portfolios. For instance, direct lending is better suited to established blockchain companies with stable EBITDA, while ABF and venture debt are more appropriate for early-stage startups needing extended runway [5]. Direct lending fees, averaging 3.81% of NAV, are often weighed against the strategy’s stability and covenant protections [5].
Conclusion
Building an effective portfolio allocation strategy means aligning each investment approach with specific portfolio needs. Direct lending stands out with its senior secured positions, floating-rate protection, and strict covenants, offering a layer of downside protection for established blockchain companies with stable cash flows.
On the other hand, private credit funds bring diversification and higher return potential, though they come with liquidity constraints. Asset-based finance strategies, with potential returns of 12–20%, are particularly suitable for early-stage Web3 startups. These strategies work well for ventures involving debt with equity participation or lending against protocol revenues, though they require navigating reduced liquidity and more intricate structures.
These distinctions highlight the importance of tailoring allocations to specific goals. For Web3 portfolios, a blended approach often works best. Direct lending can provide stability as a core allocation, while specialized private credit strategies can capture growth opportunities. This balance ensures that each strategy aligns with the portfolio’s objectives, enabling well-informed decisions in the evolving Web3 space.
When selecting managers, focus on those with strong workout capabilities, especially since recovery rates in blockchain sectors average around 33%, compared to 52% in traditional industries [7]. Manager performance varies widely between top and bottom quartiles, so thorough due diligence is critical. With tokenized private credit now accounting for $12–16 billion of the real-world assets market [2], investors can choose between traditional structures or on-chain protocols like Maple and Centrifuge. Whatever the choice, ensure your allocation matches your liquidity needs and risk tolerance. Spreading investments across 2–3 years and multiple managers can help mitigate timing and concentration risks [6].
FAQs
How do I decide between private credit funds and direct lending?
Choosing between private credit funds and direct lending comes down to your personal preferences regarding risk, involvement, and liquidity.
Private credit funds give you access to a professionally managed portfolio, offering diversification and exposure to a range of opportunities. Meanwhile, direct lending allows for more customized negotiations, potentially higher returns, and increased control over investments.
When deciding, think about factors like current market conditions - such as falling yields and growing competition - and how they align with your financial goals and risk appetite. Each option has its own set of advantages and challenges, so weigh them carefully to make the best choice for your situation.
What liquidity and lockup terms should I expect in each strategy?
Private credit strategies often come with longer lockup periods, typically ranging from 1 to 5 years. During this time, liquidity is limited until maturity or through secondary sales, which might be challenging to execute or involve discounts. Direct lending strategies, on the other hand, align lockup periods with the maturity of the loans, usually spanning 3 to 7 years, and offer few early redemption options. Both approaches feature restricted liquidity, which can vary depending on the specific fund structure and terms. Investors should take a close look at their long-term capital requirements before committing.
What due diligence matters most when picking a private credit manager?
When selecting a private credit manager, it’s important to evaluate their track record, expertise in private credit strategies, and approach to risk management. Pay close attention to their underwriting process, how they construct portfolios, and their ability to manage distressed assets effectively.
Additionally, look at how well their interests align with yours. Transparency and clear reporting practices are essential to maintaining proper oversight. Finally, consider their experience in handling regulatory shifts and navigating different market cycles - these factors can play a big role in mitigating potential risks.
Related Blog Posts
- 7 Key Metrics for Evaluating Web3 Investment Opportunities
- Institutional Strategies for Digital Asset Portfolios
- DeFi Lending vs Money Market Funds: Yield and Risk Compared
- Tokenized Treasury Bills vs On-Chain Yield: Allocation Models